Building a 3D periodic table with WebGL
Technical notes from building the interactive periodic table: chemistry data, React Three Fiber, atomic models, performance, and interface decisions.
Building an interactive periodic table looks, at first, like a data problem: 118 elements, symbols, atomic masses, electron configurations, melting points, boiling points, densities, electronegativity.
In practice, it is mostly an interface problem.
The hard part is not having the data. The hard part is making that data coexist with a 3D scene, without making the page slow, noisy, or unusable on a small screen.
Separating data, view, and atomic model
I keep element data in structured, typed files, then build the UI around a stable shape: each element exposes the fields needed by the grid, the information panel, and the atomic scene.
That separation matters because the table has several reading modes:
- standard view for name, symbol, atomic number, and mass
- heatmaps for physical properties
- states of matter
- periodic table blocks
- negative mode for contrast and readability
When the data shape stays predictable, adding a property or a thematic view does not require rewriting the main components.
Why React Three Fiber
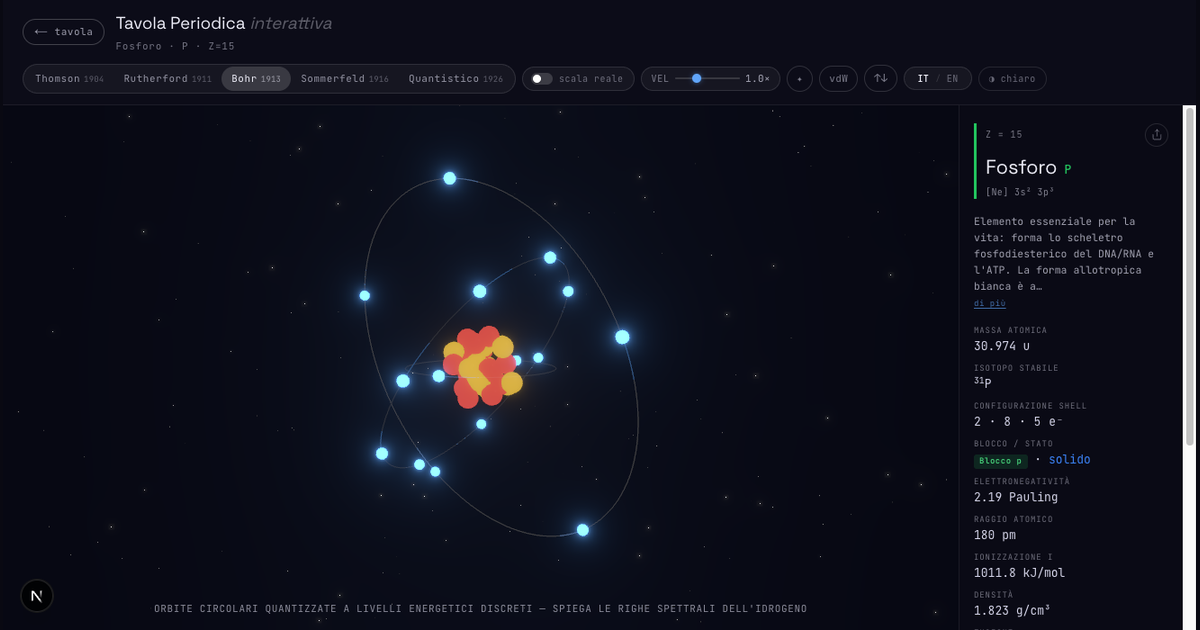
The atomic scene uses Three.js through React Three Fiber. The reason is pragmatic: I wanted to stay inside React's component model, while still controlling meshes, lights, materials, orbits, and animations directly.
Each atomic model has different needs. Rutherford and Bohr are relatively geometric. Sommerfeld needs elliptical orbits. The quantum model is closer to a visual representation of probability than to a system of trajectories.
React Three Fiber lets me compose these models as separate components, while sharing controls such as speed, real scale, star intensity, theme, and electron spin visualization.
The grid is harder than the 3D scene
The surprising part was this: the WebGL scene is complex, but the periodic table grid requires more discipline.
A periodic table must remain recognizable. Cells need to stay square, groups need to align, text needs to stay readable, and thematic views must not destroy the visual hierarchy.
On desktop, the problem is fitting 18 columns and 11 rows into the viewport without crushing everything. On mobile, the opposite problem appears: zoom, pan, and selection must work without making taps ambiguous.
The current solution combines viewport-aware CSS, stable cell aspect ratios, pinch-to-zoom, and a two-step selection flow: first highlight the element, then open its detail view.
SEO and indexable content
A highly interactive page can easily end up with little readable content on first scan. That is why I separated the main page from the about page: the first one is the tool, the second explains the technology, data sources, inspiration, and roadmap.
The next reasonable optimization is to add more server-rendered text around the main page, without polluting the experience. The goal is not to turn the lab into an article. The goal is to give search engines and users clear context before or after the interaction.
What remains open
The next technical features I care about most are:
- common isotopes, because they connect atomic mass and nucleus
- material view, because it brings elements back from symbols to real objects
- crystal structures, because they turn the table from a catalog of atoms into a catalog of matter
The direction is this: do not add effects, add layers. Every new layer should explain something the grid alone cannot show.