What an atomic orbital actually shows you
An orbital is not an orbit: it's a probability distribution with phase, nodes and shape. What you see in the periodic table's orbital inspector.
An orbital is not an orbit.
The most common mistake when you first see the 3D visualization of a 2p or a 3d is to think the electron sits there, that it moves between those lobes, that it orbits like a planet around the Sun.
It doesn't.
What an orbital is
An orbital is the solution of the Schrödinger equation for an electron bound to a nucleus. It does not describe where the electron is: it describes where it might be, and with what probability.
Formally, an orbital is a wavefunction ψ(r, θ, φ). The square of its modulus (|ψ|²) is the probability density: it tells you the probability per unit volume of finding the electron at that point in space.
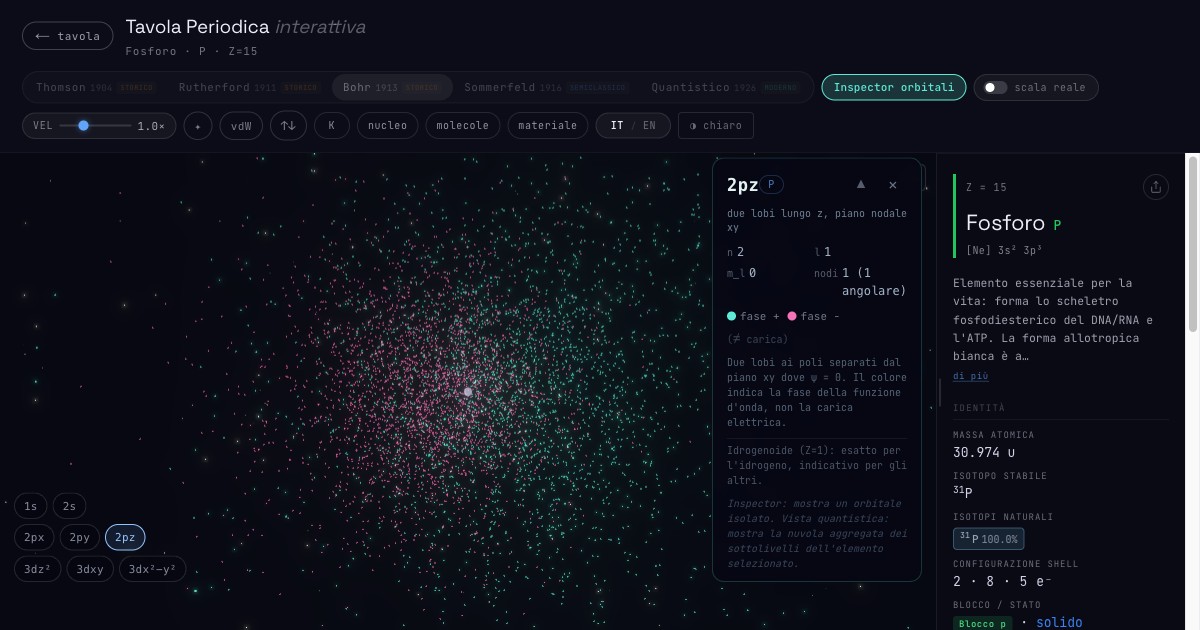
What you see in the periodic table's orbital inspector is a cloud of points sampled with probability proportional to |ψ|². More points in a region → more likely to find the electron there. Fewer points → less likely.
Phase: teal and pink don't mean charge
The colour in the visualizer does not indicate charge or density.
It indicates the phase of the wavefunction ψ.
ψ is a function that can be positive or negative in different parts of space. In the 2pz orbital the upper lobe has ψ > 0 (teal) and the lower lobe has ψ < 0 (pink). Yet both lobes contribute equally to the probability density, because |ψ|² is always positive.
Phase becomes relevant in chemical bonding: two wavefunctions add (constructive interference → σ bond) or subtract (destructive interference → σ* antibond). Same phase between two atoms = bond. Opposite phases = antibond.
Nodes: where the electron cannot be
A node is a surface where ψ = 0, and therefore where the probability of finding the electron is exactly zero.
There are two kinds:
- Radial nodes: spherical surfaces. The 2s orbital has one radial node: a concentric sphere where ψ changes sign. In the visualization it appears as a spherical gap between two regions of density.
- Angular nodes: planes or cones. The 2pz orbital has one angular node: the xy plane, where ψ = 0 and the point cloud is absent.
General rule for an orbital with principal quantum number n and angular momentum l:
- radial nodes = n − l − 1
- angular nodes = l
- total nodes = n − 1
Why s is spherical, p has two lobes, d is more complex
The shape depends on the angular-momentum quantum number l:
- l = 0 (s): full spherical symmetry. ψ depends only on the distance from the nucleus r, not on direction. The result is a sphere.
- l = 1 (p): two lobes separated by a nodal plane. ψ depends on cos θ or sin θ. The three 2px, 2py, 2pz orbitals are identical but oriented along the three Cartesian axes.
- l = 2 (d): more complex structures. 3dxy and 3dx²−y² have four lobes in the xy plane (they differ only by a 45° rotation). 3dz² is the most unusual: two polar lobes and an equatorial torus, separated by two nodal cones.
As l rises, the angular structure gets richer: more nodes, more lobes, more possible directions in space.
In heavy atoms reality is more complicated
The orbitals shown in the Fosforonero inspector are hydrogenic (Z=1): computed for a single electron around one proton. They are exact solutions of the Schrödinger equation for that specific case.
In multi-electron atoms (that is, all the others) each electron feels not only the nucleus but also the repulsion of the other electrons. Exact closed-form solutions don't exist. Approximate methods are used: Hartree–Fock, DFT, post-HF.
Hydrogenic orbitals stay useful because they:
- give the right qualitative structure (lobes, nodes, spherical symmetry for s)
- explain the filling rules (Aufbau principle, Hund's rule, Pauli exclusion)
- are the basis of the 1s²2s²2p⁶… notation used everywhere
But they are not an exact simulation of real atoms. They are a teaching model: precise in the principles, simplified when applied to heavy elements. The table states this explicitly in the inspector: "hydrogenic (Z=1): exact for hydrogen, indicative for the rest."
How the visualizer works
The orbital inspector uses a rejection-sampling algorithm. For each point it generates a random position in space, computes |ψ(x,y,z)|², and accepts the point with probability proportional to |ψ|² relative to the known maximum for that orbital.
The result is a cloud of ~9000 points (3500 on mobile) whose density faithfully mirrors the quantum probability density. Each point's colour depends on the sign of ψ there: teal if ψ > 0, pink if ψ < 0.
The random-number generator is deterministic (mulberry32 with a fixed per-orbital seed): the cloud is the same on every load, reproducible and comparable across sessions.
The cloud rotates slowly about the y axis to give the three-dimensional structure depth. Nodes appear as empty regions, zones where no point is accepted because the probability is zero.
It is not decorative graphics. It is a quantitative visualization of the hydrogen wavefunction.