Why I built an interactive periodic table
The idea behind Fosforonero's 3D periodic table: chemistry, historical atomic models, and WebGL visualization inside a browser-based educational lab.
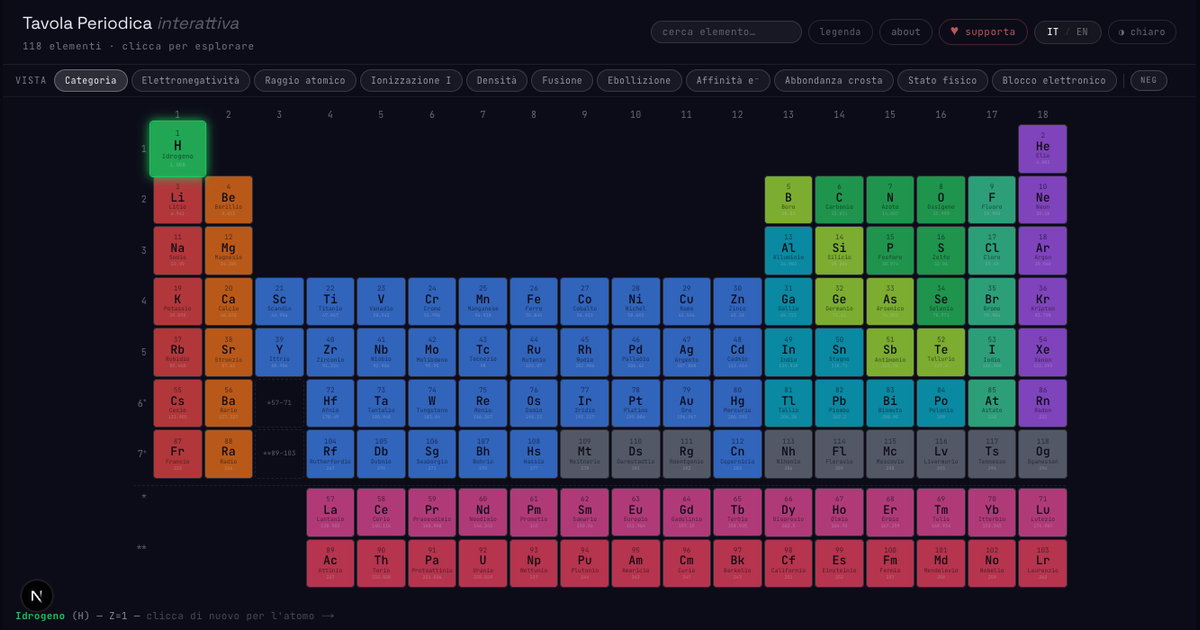
The periodic table is one of the most successful scientific interfaces ever designed. In a compact grid, it connects atomic number, chemical families, recurring properties, and a large part of the history of matter.
But it is often treated as a static poster. That works when you need a symbol or an atomic mass, but it does not say much about the transition I cared about most: what happens when you move from a tile down to the atom.
That is where the Interactive Periodic Table started.
A table you can explore
The goal was not to rebuild a small Wikipedia. I wanted a more physical tool: select an element, isolate it, read its essential data, then switch atomic model and look at the same element through different scientific ideas.
That is why the page does not only show 118 elements. Next to the grid there is a real-time 3D scene with five historical models:
- Thomson, with the atom as a diffuse positive body
- Rutherford, with a compact nucleus and orbiting electrons
- Bohr, with discrete energy shells
- Sommerfeld, with elliptical orbits
- Schrödinger, with a more probabilistic representation
These models are not equivalent, and they should not be read as visual skins for the same object. They are conceptual steps. Putting them in the same tool helps show that science is also a history of models: each representation solves something and leaves something else open.
The inspiration: changing scale
On the table's about page, I mention Powers of Ten by Charles and Ray Eames. It is the right reference because this project does not come only from chemistry, but from the idea of crossing scales without losing orientation.
Today the table mainly shows the element-to-atom transition. The broader direction is macroscopic material, crystal structure, atom, nucleus, and sub-nuclear particles. Not as a perfect simulation, but as a progressive visual map.
That is the kind of educational work I like: accurate enough not to become decoration, interactive enough to invite exploration.
Why build it in the browser
The browser is the natural place for this experiment. There is nothing to install, no account to create, and no server required to compute the scene on every request. Data, interaction, and 3D rendering all run client-side.
That has an obvious cost: page weight, mobile performance, and indexable fallback content need care. But it also has a major advantage: someone can open a link and start exploring immediately.
For a free educational project, low friction is a feature.
What I want to improve
The most interesting part is still ahead. The roadmap includes isotopes, material views, state transitions with a temperature slider, crystal structures, and a deeper zoom into the nucleus.
The question behind all of it is simple: how much can I make visible without turning the tool into a confusing toy?
The periodic table is already a great abstraction. The work is to respect it, and add motion only where motion helps understanding.